Understanding Market Divergences
Market divergences are powerful signals that can help traders identify potential trend reversals before they happen. Understanding how to spot and interpret divergences is a valuable skill for any cryptocurrency trader.
What Are Market Divergences?
A divergence occurs when the price of an asset and a technical indicator (like RSI, MACD, or OBV) move in opposite directions. This inconsistency between price and indicator suggests a potential weakening of the current trend and a possible reversal.
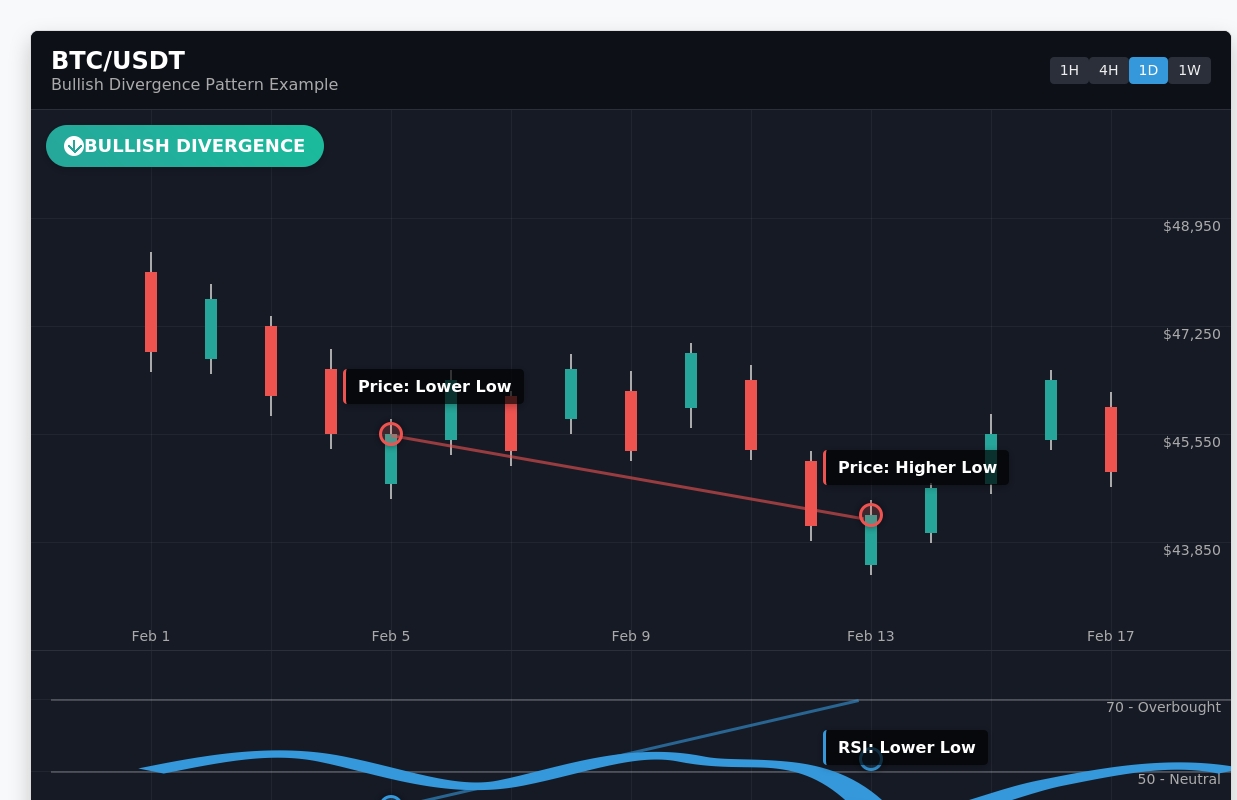
Bullish Divergence
When price makes a lower low, but the indicator makes a higher low. This suggests bearish momentum is weakening and a potential upward reversal may be coming.
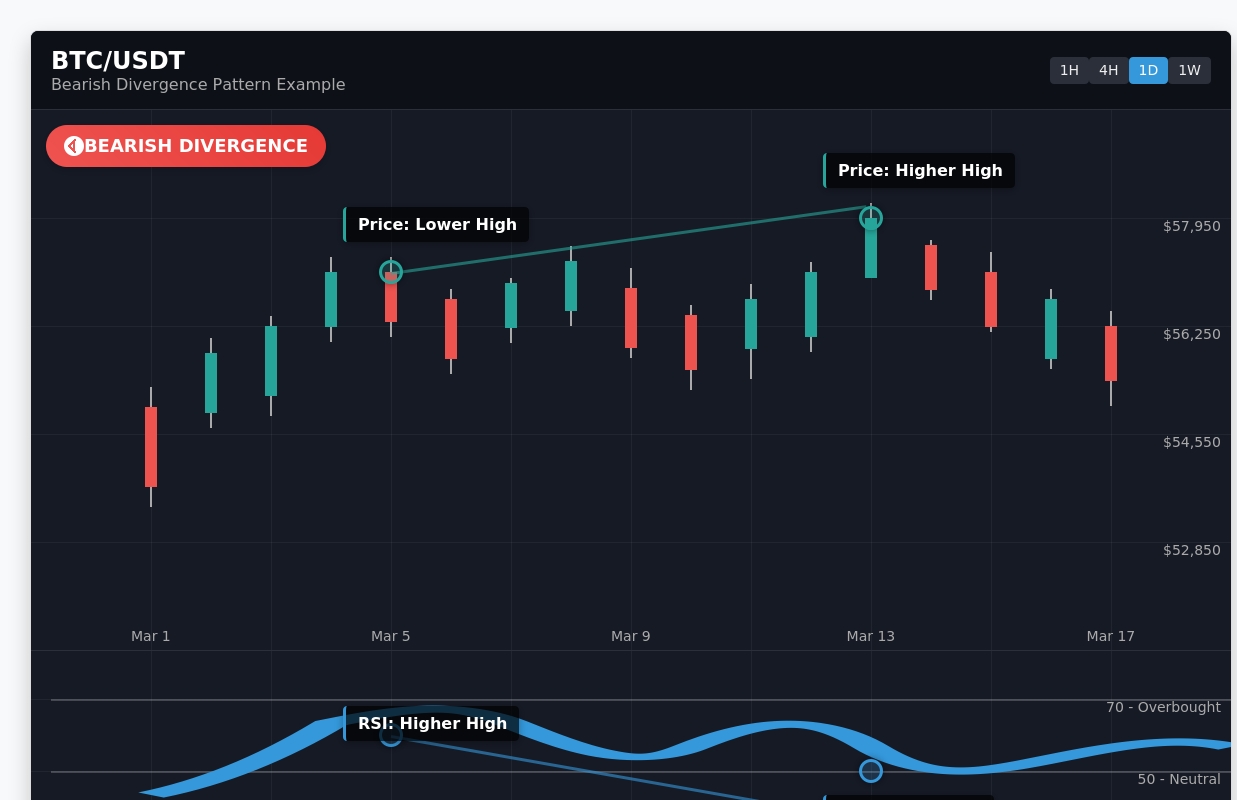
Bearish Divergence
When price makes a higher high, but the indicator makes a lower high. This suggests bullish momentum is weakening and a potential downward reversal may be coming.
Why Divergences Matter in Trading
Divergences can provide early warning signals of potential trend changes, often before traditional price action signals appear. Here's why traders should pay attention to divergences:
- Early Warning System: Divergences can signal a potential reversal before it happens in price, giving traders time to prepare.
- Confirmation Tool: When used alongside other technical indicators, divergences can strengthen your trading thesis.
- Risk Management Aid: Identifying potential trend weaknesses helps in setting appropriate stop-loss levels.
- Market Psychology Insight: Divergences reflect changes in buying/selling momentum that aren't yet visible in price action.
Divergences Across Different Timeframes
Divergences can appear on any timeframe, from 1-minute charts to weekly or monthly charts. Understanding how to interpret divergences across different timeframes is crucial:
Short-Term Timeframes (Minutes to Hours)
Divergences on shorter timeframes (1h, 4h) occur more frequently but may generate more false signals. These are useful for day traders and scalpers looking for quick entry and exit points.
Short-term divergences may indicate temporary pullbacks rather than major trend reversals.
Medium-Term Timeframes (Daily)
Divergences on daily charts provide a balance between signal frequency and reliability. These are valuable for swing traders and position traders.
Medium-term divergences often signal more significant moves that can last days to weeks.
Long-Term Timeframes (Weekly, Monthly)
Divergences on weekly or monthly charts are less common but highly significant when they appear. These are important for long-term investors and trend followers.
Long-term divergences can signal major market shifts and potential trend changes that last months or even years.
Multi-Timeframe Analysis
The most powerful trading setups often occur when divergences align across multiple timeframes. For example, a bearish divergence on both the 4-hour and daily charts suggests stronger downside potential than a divergence on just one timeframe.
Our platform specifically tracks these multi-timeframe divergence patterns to identify the highest-probability trading opportunities.
How to Use Divergence Information
Finding divergences is just the first step. Here's how to effectively incorporate divergence analysis into your trading strategy:
-
Confirm with Price Action
Wait for price action confirmation (like a breakout, support/resistance test, or candlestick pattern) before acting on a divergence signal.
-
Consider the Broader Trend
A divergence against a strong trend is less likely to result in a full reversal than one that appears near support/resistance levels or after an extended trend.
-
Use Multiple Indicators
Look for divergences across multiple indicators (RSI, MACD, OBV) for stronger signals.
-
Set Appropriate Stops
Divergences aren't guarantees. Always use proper risk management with well-placed stop losses.
-
Context Matters
Consider market conditions, news events, and broader economic factors when interpreting divergence signals.
Common Divergence Trading Mistakes
Being aware of these common pitfalls can improve your divergence trading results:
- Overtrading Minor Divergences: Not all divergences lead to significant moves. Focus on clear, well-defined patterns.
- Ignoring the Broader Trend: Trading against a strong trend based solely on a divergence can be risky.
- Failing to Wait for Confirmation: Entering trades too early before price action confirms the divergence signal.
- Improper Stop Placement: Setting stops too tight or too loose relative to the divergence pattern.
- Neglecting Timeframe Contexts: Not understanding how divergences on different timeframes interact and influence each other.
How Our Platform Helps
The Crypto Divergences Parser platform is specifically designed to identify and track divergence patterns across multiple cryptocurrency pairs and timeframes:
- Automated divergence detection saves hours of manual chart analysis
- Real-time alerts when significant divergences form
- Multi-timeframe analysis to identify the strongest signals
- Historical performance data for different divergence patterns
- Filtering tools to focus on the most relevant signals for your trading style